An Introduction to On-Chain Analysis in Cryptocurrency
When choosing cryptocurrency, two common approaches are technical analysis and fundamental analysis. However, thanks to blockchain technology, cryptocurrency can also be analyzed using on-chain data.
In the following article, we’ll dive deeper into technical analysis for cryptocurrency. We’ll explain what it means, why it’s important, and how to do it.
What is On-Chain Analysis?
On-chain analysis is a method that involves reading information and data recorded directly on a blockchain network. Since blockchains only exist for cryptocurrencies, this makes crypto the only type of asset that can be analyzed using on-chain methods.
Through this data, we can see the supply and demand for a specific coin or token, understand how people feel about the market, and track network activities like mining.
The goal of on-chain analysis is to evaluate cryptocurrency based on their real usefulness and fundamental value.
How to Do On-Chain Analysis
When doing on-chain analysis, there are a few key things to consider. One is watching the different types of participants on the blockchain network. Groups whose movements you can observe include “whale” investors (those holding large amounts of crypto), exchanges, miners, and everyday traders (speculators).
Besides these groups, you should also look at transaction data. For example, check the total transaction volume, the number of active addresses, and any large transfers of funds between wallets. To help understand this data, you can use specific indicators like unrealized profit or loss and Market Value to Realized Value (MVRV), among others.
To get this data, investors can use special analysis platforms that provide on-chain data services, such as Glassnode, CryptoQuant, Bitbo, or Coin Metrics.
Key Metrics in On-Chain Analysis
- Active Addresses and Number of Transactions
These are common ways to see how often and how much a blockchain network is used. Active addresses count the number of unique wallets that send or receive transactions within a certain period. Meanwhile, the number of transactions simply counts all the total transactions that happen.
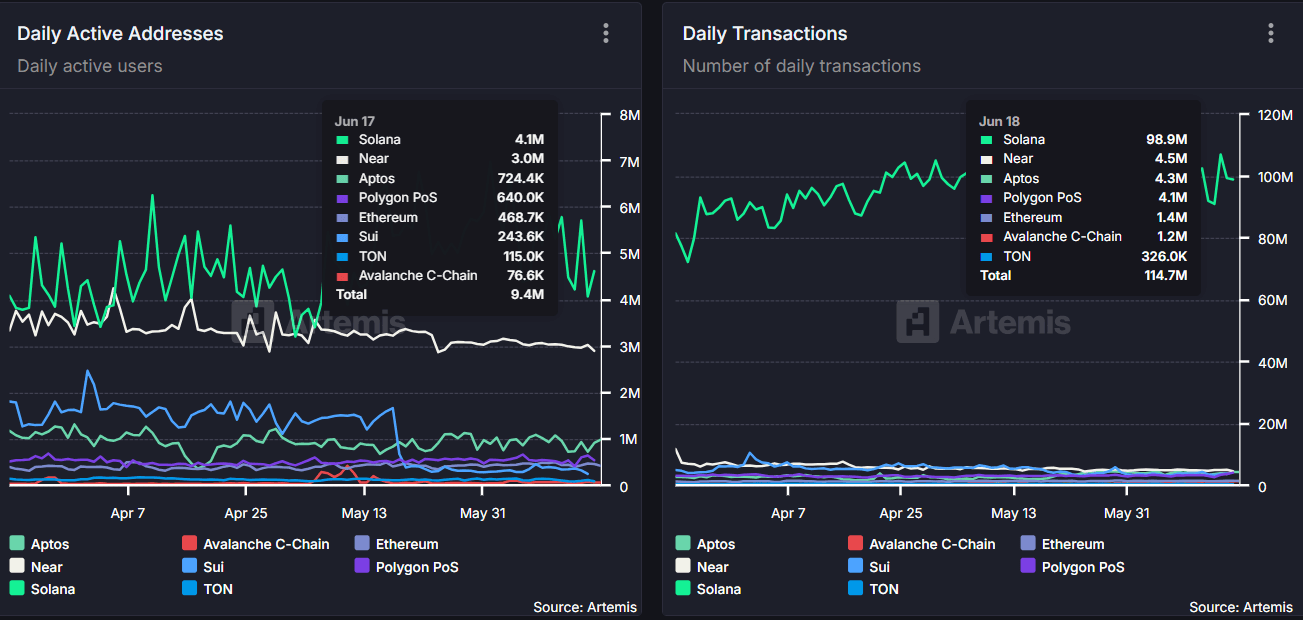
If both these numbers go up, it means the asset is being adopted and used more. This shows that the network is popular and actively used. If active addresses and transaction volume go down, it suggests less interest and activity on the network.
Unrealized Profit or Loss
Unrealized profit or loss is an on-chain metric that measures the total gains or losses that cryptocurrency holders have on paper (meaning they haven’t sold yet). It’s calculated by comparing the price they bought the tokens at with the current market price.
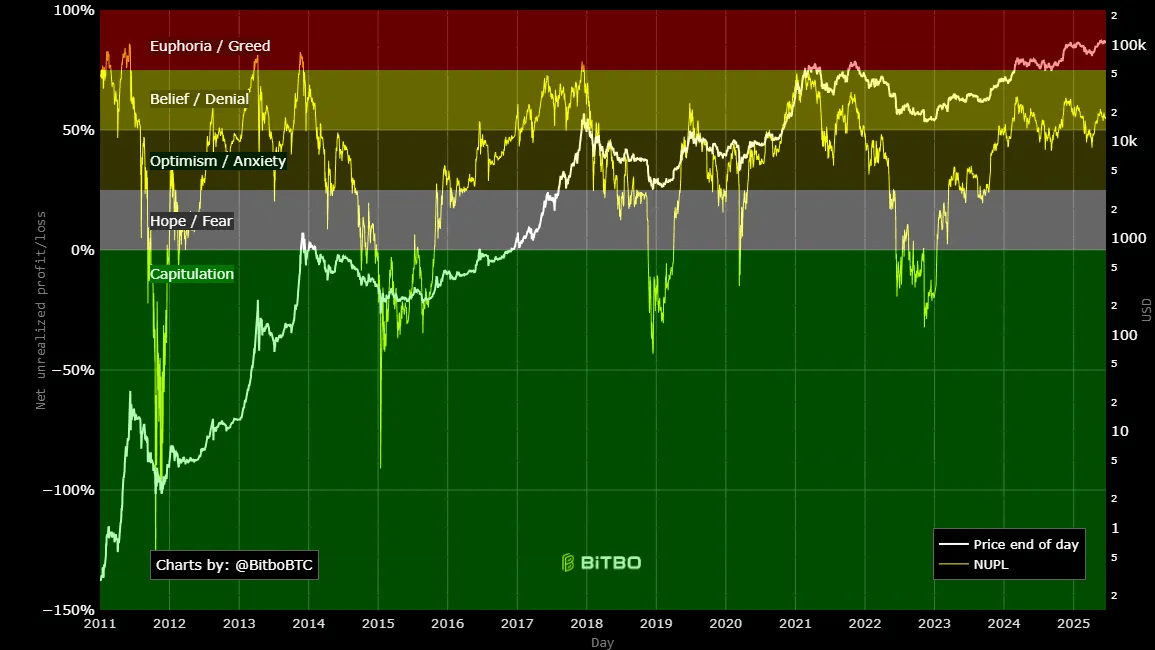
This indicator helps us understand general market sentiment. In an uptrend (bullish market), the feeling often moves from capitulation (giving up) to hope, then optimism, greed, and finally euphoria (extreme excitement). In a downtrend (bearish market), the feeling shifts from euphoria back through greed, optimism, hope, and eventually capitulation.
The capitulation phase is generally seen as the best time to buy, while euphoria is considered the best time to sell.
Market Value to Realized Value (MVRV)
This indicator compares an asset’s current market value (its total value at today’s price) with its realized value (the value when each part of the asset last moved on the blockchain). If the MVRV ratio is above 1, it means that many asset owners are currently making a profit on paper. A higher MVRV ratio suggests that more unrealized profits exist, which could signal that the market is becoming too expensive and might see a price correction.
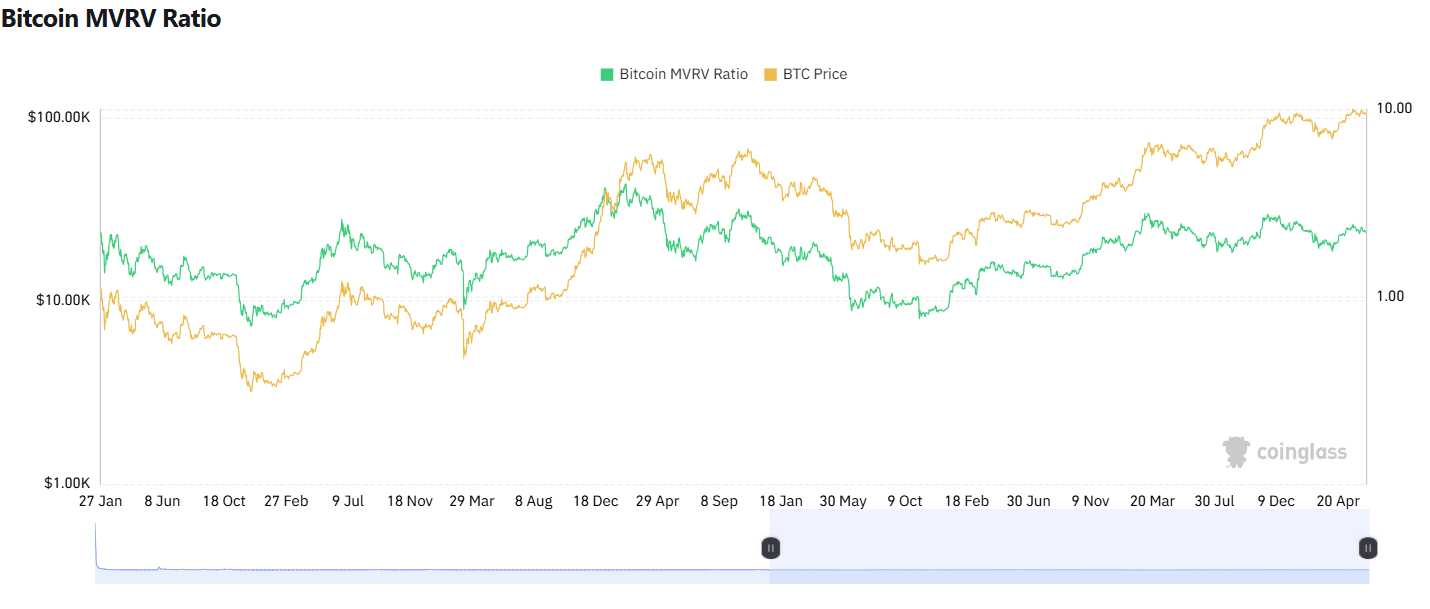
On the other hand, if the MVRV is below 1, it means most investors are currently at a loss. A very low MVRV ratio might suggest that the asset is undervalued or has reached its lowest point in the market, making it potentially ready for a price rebound.
Advantages of On-Chain Analysis
- Transparency
On-chain data is public and can’t be changed, which makes it very transparent. This allows anyone to check transactions and other activities independently.
- Market Sentiment
By looking at how wallets move and how much is transacted (volume) on the blockchain, investors can get a good sense of how the market is feeling.
- Identifying Anomalies
On-chain data can show unusual activities. For example, very large asset transfers or sudden spikes in transaction volume might point to an important event or even possible market manipulation.
Disadvantages of On-Chain Analysis
- Data Complexity
Blockchain data is very complex. You need the right tools and analytical skills to understand it properly. The data isn’t useful if you can’t analyze it correctly.
- Interpretation-Based
Interpreting on-chain network data can be tricky because you need to understand the context of the data within the larger market conditions. How you interpret it heavily depends on your own understanding.
- Incomplete View
More and more transactions now happen off-chain, through centralized exchanges and derivatives platforms. Because of this, on-chain analysis only gives you a partial look at all the activity happening in the crypto market.