How to Find Support and Resistance Levels
Support and resistance are common terms used when talking about buying and selling cryptocurrency. Phrases like “Wait until the price breaks through resistance” or “The price could continue to the support area” might confuse some people.
Support and resistance can help us identify whether the price of a cryptocurrency will go up or down. So, what exactly are support and resistance? How do we find them? What is their purpose? Let’s find out the answers in this article.
What is Support?
Support is the lowest price point for a cryptocurrency during a price trend. When a cryptocurrency moves towards the support area, many market participants will buy because they expect the price to bounce back up. At the same time, some market participants will hold onto their positions because the price hasn’t yet gone below the support level.
This situation makes the support area an ideal place to buy. Why? Because increased demand can cause the price to rise again. This buying activity further strengthens the support level itself. So, support acts like a “floor” that stops the price from falling further.
What happens if the price breaks below the support level? If the price goes below the support level, it can indicate that the price decline will continue until a new support level is found. This drop shows a shift where sellers are more dominant than buyers.
What is Resistance?
Resistance is the highest price point for a cryptocurrency within a price trend. When a cryptocurrency approaches the resistance area, many market participants take profits because they believe the price has reached its peak. On the other hand, some market participants hesitate to buy due to the possibility of price drops.
This situation makes the resistance area an ideal place to sell. Why? Because many market participants see the asset as being too expensive. This selling activity also strengthens the resistance level. In other words, resistance acts like a “ceiling” that stops the price from rising further.
When the resistance level is broken, it signals that the price increase will continue until a new resistance level is found. This increase also shows that buyers are dominating the market.
How to Determine Support and Resistance
There are two common ways to find support and resistance areas.
First, you can draw a trendline, which is a diagonal line that shows if an asset’s price is generally going up or down. Second, you can draw a horizontal line at a price point where the price has previously bounced back or been rejected.
The more times the price touches a trendline or horizontal line, the more accurate that line is in identifying support and resistance areas. You can see examples in the chart illustrations below.
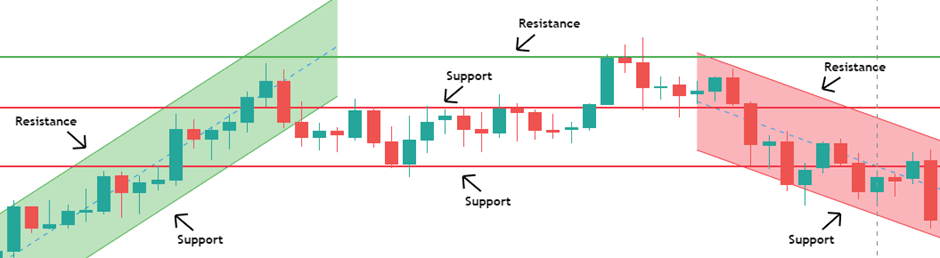
Image Source: Coinvestasi
The green diagonal line in the chart shows an upward price trend. The red diagonal line shows a downward price trend. In these cases, the line above acts as the resistance area, and the line below acts as the support area.
You’ll notice that every time the price gets close to the support area, it tends to bounce back up and continue the upward trend. At the same time, the price movement often can’t break through the resistance area.
Meanwhile, horizontal lines are more dynamic. Every time a resistance line is crossed, it can then become a support area. In some situations, prices seem to bounce every time they approach a support area. However, once that support area is broken, the price trend can reverse and go downwards, and the previous support line then turns into a resistance line.
It’s important to remember that support and resistance levels aren’t always fixed. Just like the market is always changing, support and resistance levels can also shift based on the current market trend.
The Uses of Support and Resistance
Here’s how support and resistance can be useful in cryptocurrency investing:
Determining Buying and Selling Areas for Cryptocurrency
Support and resistance can act as guides for when to buy and sell. Ideally, you’d buy when the cryptocurrency’s price is in the support area and then sell when the price reaches the resistance area. This approach can help investors get the best possible results.
However, it’s crucial to understand that support and resistance areas aren’t absolute. There’s always a chance they might be broken, leading to new support and resistance areas forming. Therefore, you shouldn’t treat support and resistance areas as guaranteed references.
Risk Management
Support and resistance levels can also be used as tools to manage your risk. For example, if the price drops below a support level, investors can quickly place a stop-loss order to prevent further losses. Conversely, if the price rises above a resistance level, investors can immediately take profits.
Using support and resistance levels for risk management can help investors stay disciplined. Failing to place stop-loss and take-profit orders is something to avoid when investing in cryptocurrency.